Monitoring and observability for a reliable software system.

Tiago Silva
4 min read • May 8, 2023
As software development and deployment become increasingly complex, monitoring, and observability have become essential practices to ensure the reliability and performance of software systems.
")
Blog Banners NO text (3)
As software development and deployment become increasingly complex, monitoring, and observability have become essential practices to ensure the reliability and performance of software systems. Grafana, Loki, and Prometheus are three powerful tools that can be used together to provide comprehensive monitoring and observability.
Observability is a key aspect of modern software development and operations. It refers to the ability to gain insight into the internal state of a system based on its external outputs. In software engineering, observability is the practice of instrumenting software systems with monitoring, logging, and tracing capabilities to enable teams to quickly identify, troubleshoot, and resolve issues as they arise. Observability helps teams gain a better understanding of the behavior and performance of their systems and proactively identify and address potential issues before they impact end-users. By increasing observability, organizations can improve the reliability, scalability, and performance of their systems, and provide more value to their customers.
Let’s explore a bit more in-depth the tools I’ve mentioned just now.
Prometheus
Prometheus is an open-source monitoring system that collects metrics and data from a variety of sources, including software applications, servers, and network devices. Prometheus stores this data in a time-series database and provides a powerful query language (PromQL) to analyze and visualize the data. With Prometheus, we can monitor the performance of systems in real-time, identify performance bottlenecks and issues, and proactively address them.
Grafana
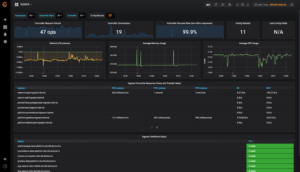
Grafana is an open-source platform for visualizing and analyzing data. With Grafana, we can create customizable dashboards and visualizations for our data. Not only does it offer a wide range of visualization options, including charts, graphs, and heatmaps, but also lets us set up alerts and notifications for specific metrics or events, so we can quickly respond to potential issues.
Grafana Loki
Loki is a horizontally-scalable, highly available, multi-tenant log aggregation system inspired by Prometheus. Loki is designed to collect, index, and search logs from any source, facilitating troubleshooting and root cause analysis. Loki integrates seamlessly with Prometheus, allowing users to correlate logs with metrics and data to gain deeper insights into system performance.
Possible use at LOAD
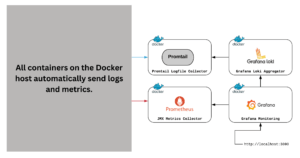
Most of LOAD’s projects are deployed on the same Docker host. With this in mind, we can use Prometheus to collect metrics and data from each Docker container. Grafana can be used to visualize this data on a single dashboard, making it easier to identify and diagnose issues across all projects. Similarly, by using Loki to aggregate logs from each container, developers can quickly search and analyze logs across all projects to identify the root causes of issues. With the ability to collect and analyze data and logs across projects, we can streamline our monitoring processes, improve system performance and reliability, and ultimately deliver more value to our customers.
Conclusion
Together, Prometheus, Grafana, and Loki provide a powerful monitoring and observability stack. By collecting, storing, and visualizing metrics, data, and logs, we gain a better understanding of how our systems are behaving and can proactively identify and fix problems before they have a negative impact. This improves system reliability and performance, enabling our software to meet the most demanding requirements of our customers.
Tiago Silva